FRCA Notes


Enzyme Kinetics


Enzyme Kinetics Graph
  • In first-order kinetics, a constant proportion of the drug is eliminated per unit time e.g. 50% per hour
  • The rate of drug elimination varies; the rate of drug elimination at a particular time is dependent on the concentration of the drug at that time

  • The half-life in first order kinetics is constant, meaning half-life and clearance can be used to describe elimination kinetics
  • This produces an exponential decay process
  • Occurs due to non-saturatable enzymes being involved in drug elimination
  • The majority of drugs display first-order kinetics because there is a surplus of enzymes compared to that required to metabolise the clinically effective dose


Enzyme Kinetics Graph
  • In zero-order kinetics, a constant amount of the drug is eliminated per unit time e.g. 10mg per hour
  • The rate of drug elimination is constant; changing the concentration of the drug does not alter the rate of reaction

  • Half-life is not constant and increases if further doses are administered
  • Half-life and clearance cannot be used to describe elimination kinetics
  • Occurs when the elimination system (metabolic pathway) is saturated
  • Examples include:
    • Phenytoin
    • Ethanol
    • Aspirin
    • Theophylline
    • Thiopentone

Clinical implications

  • The therapeutic dose for some drugs is close to the plasma concentration at which metabolic enzymes become saturated
  • This means that:
    • A small increase in dose may lead to a large increase in plasma concentration
    • Toxicity may occur after a modest dose increase e.g. if >1unit/hr alcohol is consumed
    • There is no steady state; if drug delivery exceeds drug excretion then plasma levels will rise inexorably until ingestion stops or death by toxicity occurs

  • An enzyme is a catalyst that increases the velocity of a chemical reaction without itself being consumed in the reaction
  • The rate of a reaction is therefore dependent on the concentration of substrate [S] present and the presence of an enzyme [E]
  • E + S ⇄ ES ⇄ P

  • I.e. an increase in substrate concentration will increase reaction velocity
  • This can be plotted as a graph of reaction velocity (V0) vs. substrate concentration (S)
  • The graph produced is an inverted rectangular hyperbola, and is appropriate to describe most enzyme reactions
Michaelis-Menton kinetics graph
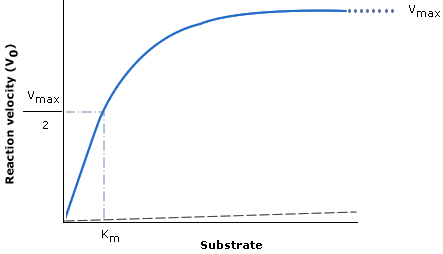
  • KM is the substrate concentration at which reaction velocity is half of maximal value
    • It changes according to the affinity of the enzyme for the substrate
    • Higher affinity = lower KM
    • It is equivalent for ED50 in drug dose-response curves
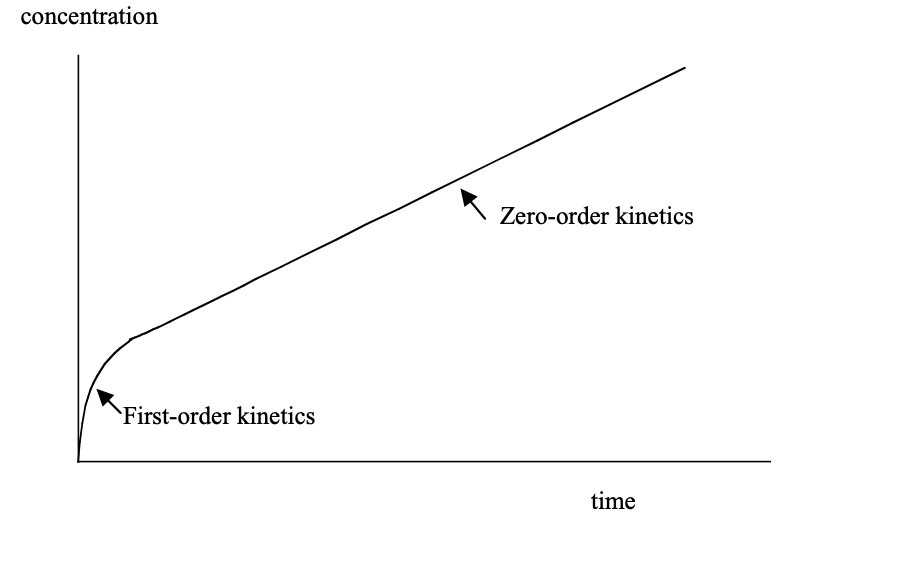
    • The portion of the curve to the left of KM exhibits first-order kinetics
    • The far right portion of the curve (horizontal) exhibits zero-order kinetics

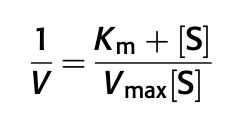
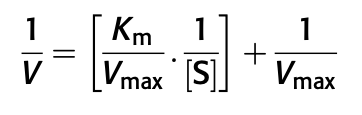
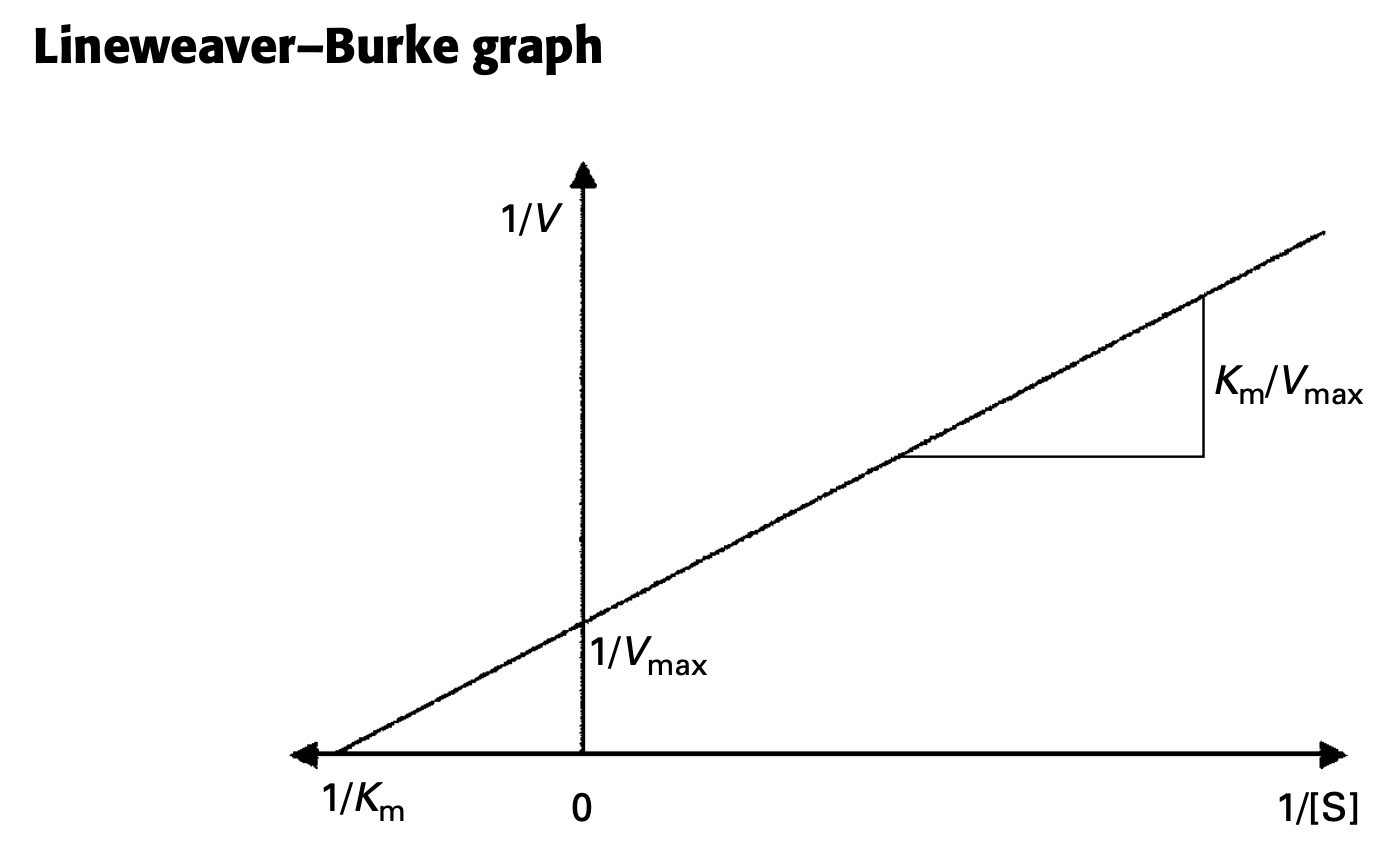
The Michaelis-Menton Equation

  • The Michaelis-Menten equation describes the rate of a biological reaction according to enzyme characteristics and substrate concentration, until it reaches enzyme saturation

  • Michaelis-Menton equation
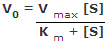
  • Enzyme kinetics are first order at low substrate concentrations, V ⍺ [S]
    • If [S] is low, the +[S] part of the equation trends to nothing
    • Therefore V is proportional to [S] by a factor of Vmax/KM , i.e. it is the [S] that will have the effect on V
    • Thus the rate depends on the concentration of the reacting components
    • It is an exponential process

  • Enzyme kinetics are zero order at high substrate concentrations (i.e. when the enzyme is saturated), V ⍺ Vmax
    • If [S] is high, the Vmax.[S] part of the equation becomes very large
    • Therefore V is proportional to Vmax i.e. V is independent of [S]
    • I.e. reaction velocity is constant and independent of substrate concentration

  • This graph uses reciprocals of the Michaelis-Menten equation to linearise the graph

  • Lineweaver-Burke equation
  • This can be arranged to form the equation:
  • Lineweaver-Burke equation rearranged
  • This is a variant of the equation for a straight line (y = mx + c)
  • Plotting this straight line makes calculating KM and Vmax easier

  • Lineweaver-Burke graph