- Compartmental models are mathematical equations
- We are interested in drug concentration, C, as a function of time:
- In general this is an exponential relationship, which can be plotted on a concentration-time graph
C = dC/dt
Positive exponential curves
- If the rate at which concentration changes increases as time increases it is a positive exponential e.g. exponential growth curve
- Relevant examples of exponential growth curves:
- Bacterial culture growth
- Lung volumes with PPV
Negative exponential curves
- If the rate at which concentration changes decreases as time increases it is a negative exponential e.g. exponential decay curve
- Relevant examples of exponential decay curves:
- Plasma concentration of a drug following a single bolus dose
- Drug wash-out curve
- Nitrogen washout during pre-oxygenation
- Lung volumes with passive expiration
- Radionuclide materials undergoing radioactive decay
- The simplest model describing this is a one compartment model:
- Where:
- C = drug concentration and is the dependent variable
- C0 = the initial drug concentration (concentration at t = 0) and is the intercept on the y-axis
- t = time and is the independent variable
- k = the rate constant for elimination and determines the 'steepness' of the curve
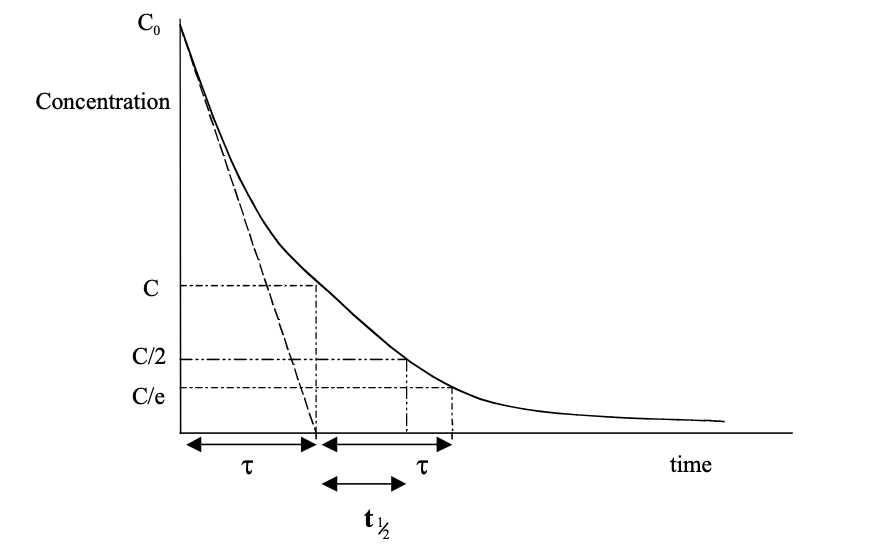
- This relationship is commonly referred to as a drug wash-out curve (curve A below)
- The wash-out curve starts at C0 and is asymptotic with zero
C = C0.e-kt
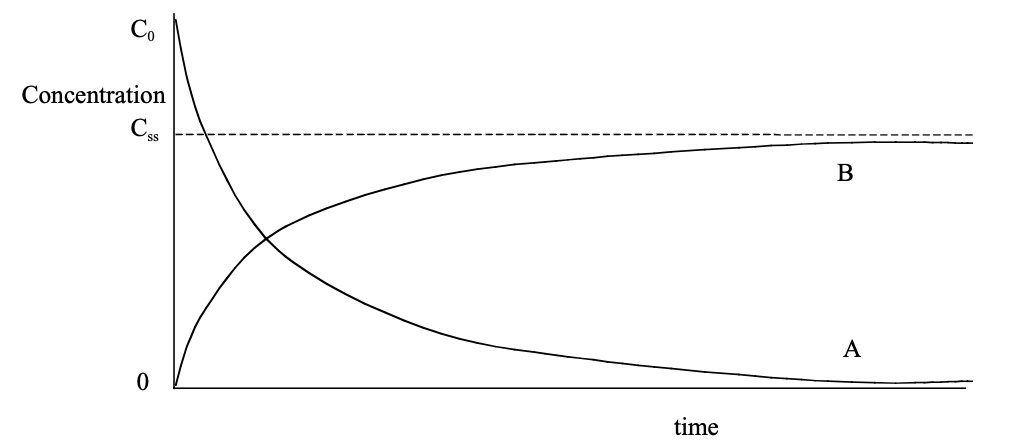
Drug wash-in curve
- The way that plasma concentration increases with time during an infusion of constant rate is termed a wash-in curve (curve B above)
- It is also a negative exponential curve (because the rate of change of concentration decreases with time)
- A wash-in curve starts at the origin and rises in a negative exponential fashion
- It is asymptotic with the concentration at steady state (Css)
- It has the equation: C = Css.(1 - e-kt)
- For both the wash-in and wash-out curves, the rate constant for elimination is k
Euler's number: 'e'
- A mathematical constant that is the base of the natural logarithm
- It has a value of approximately 2.71828