- Affinity is a measure of how avidly a drug binds to its receptor
- Affinity can be measured by the dissociation constant KD:

Adapted from Physics, Pharmacology and Physiology for Anaesthetists
- KD is the molar drug concentration at which 50% of its receptors are occupied in equilibrium (mmol/L)
- A lower KD implies a higher affinity
- Efficacy (intrinsic activity) is a measure of the magnitude of the effect once the drug is bound
- It is measured between 1 (maximal effect) and -1 (maximal opposite effect)
- Potency is a measure of the quantity of a drug to produce the maximum clinical effect
- Potency is compared using the median effective concentration (EC50) or the median effective dose (ED50)
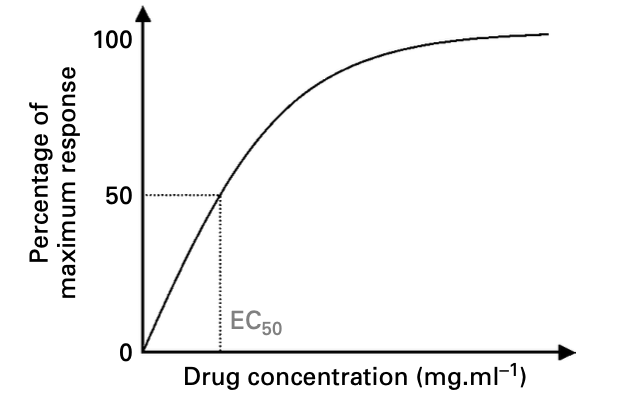
Median effective concentration (EC50)
Adapted from Physics, Pharmacology and Physiology for Anaesthetists
- EC50 is the concentration of a drug that induces a response of 50% (i.e. halfway between baseline and maximum)
- It is a laboratory result after a test using a single set of parameters or on a single animal model
- A drug with a lower EC50 is more potent
- A graph of drug concentration vs. percentage maximal response is a rectangular hyperbola, similar to the KD graph above
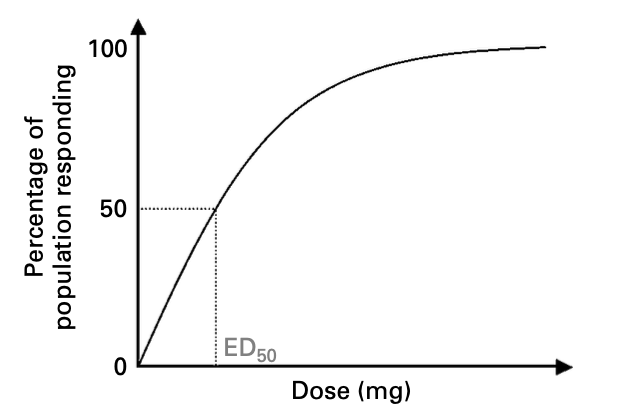
Median effective dose (ED50)
- ED50 is the dose of a drug that induces a specific response in 50% of a population to whom it is administered
- It is a measure of potency when the drug is administered to a population
- A drug with a lower ED50 is more potent
- A graph of dose vs. percentage of population response is the quantal dose-response curve, the typical dose-response curve:
Adapted from Physics, Pharmacology and Physiology for Anaesthetists
- Semi-logarithmic transformation of this curve gives the log(dose)-response curve, and the graph becomes sigmoidal:
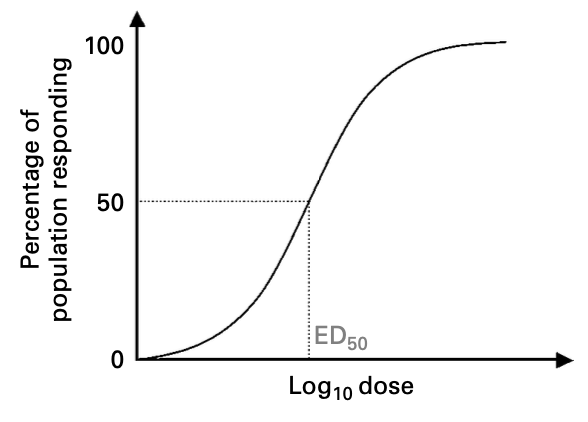
Adapted from Physics, Pharmacology and Physiology for Anaesthetists
- This is a reference log(dose)-response curve for a full agonist
- The linearity of the steep part of the log(dose)-response curve makes assessment of dose and response easier, and therefore comparisons between drugs easier
- LD50 is the dose of a drug that is lethal in 50% of a population to whom it is administered
- This gives rise to the therapeutic index:
- The therapeutic index is the ratio of LD50 to ED50
- It is a balance between a drug's toxic effects and its beneficial effects
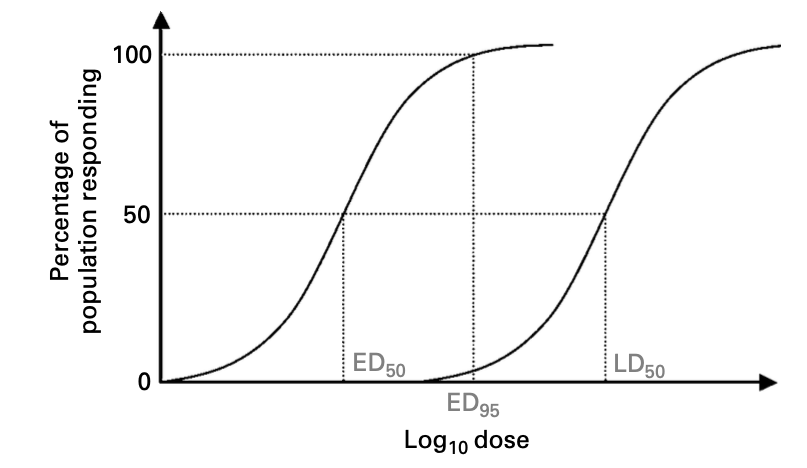
Adapted from Physics, Pharmacology and Physiology for Anaesthetists
- The ED95 is plotted to demonstrate that a dose high enough to cause the specific response in 95% of a population may also cause toxic or lethal effects in a small portion of the population
- Examples of drugs with narrow therapeutic indices include:
- Theophylline
- Digoxin
- Phenytoin
- Lithium